olympics <- readr::read_csv("https://raw.githubusercontent.com/rfordatascience/tidytuesday/master/data/2021/2021-07-27/olympics.csv")Paralympic Games Data Analysis
The Data
The dataset contains information about Paralympic Games from 1980 to 2016. It can be obtained from the TidyTuesday GitHub repository. You can find more info about the data set on the GitHub repository
In this data set you can use a lot of dplyr and ggplot2 functions to summarize and visualize the data.
Interesting variables to analyse are:
| variable | class | description |
|---|---|---|
| gender | character | Binary gender |
| event | character | Event name |
| medal | character | Medal type |
| athlete | character | Athlete name (LAST NAME first name |
| abb | character | Country abbreviation |
| country | character | Country name |
| type | character | Type of sport |
| year | double | year of games |
How to get the data
Get the data here:
For most analysis, you can simplify the dataset by filtering to include only medal winners (rows with non-missing medal information).
olympics_medal <- olympics |>
  filter(!is.na(medal))
Questions to Explore
Analyze the age distribution of Paralympic athletes.
- Tip: Consider overall distribution and how it varies by different factors (e.g., sex, medal type).
Did the ratio of male and female medal winners change with time?
- Count overall medals and plot the ratio over time
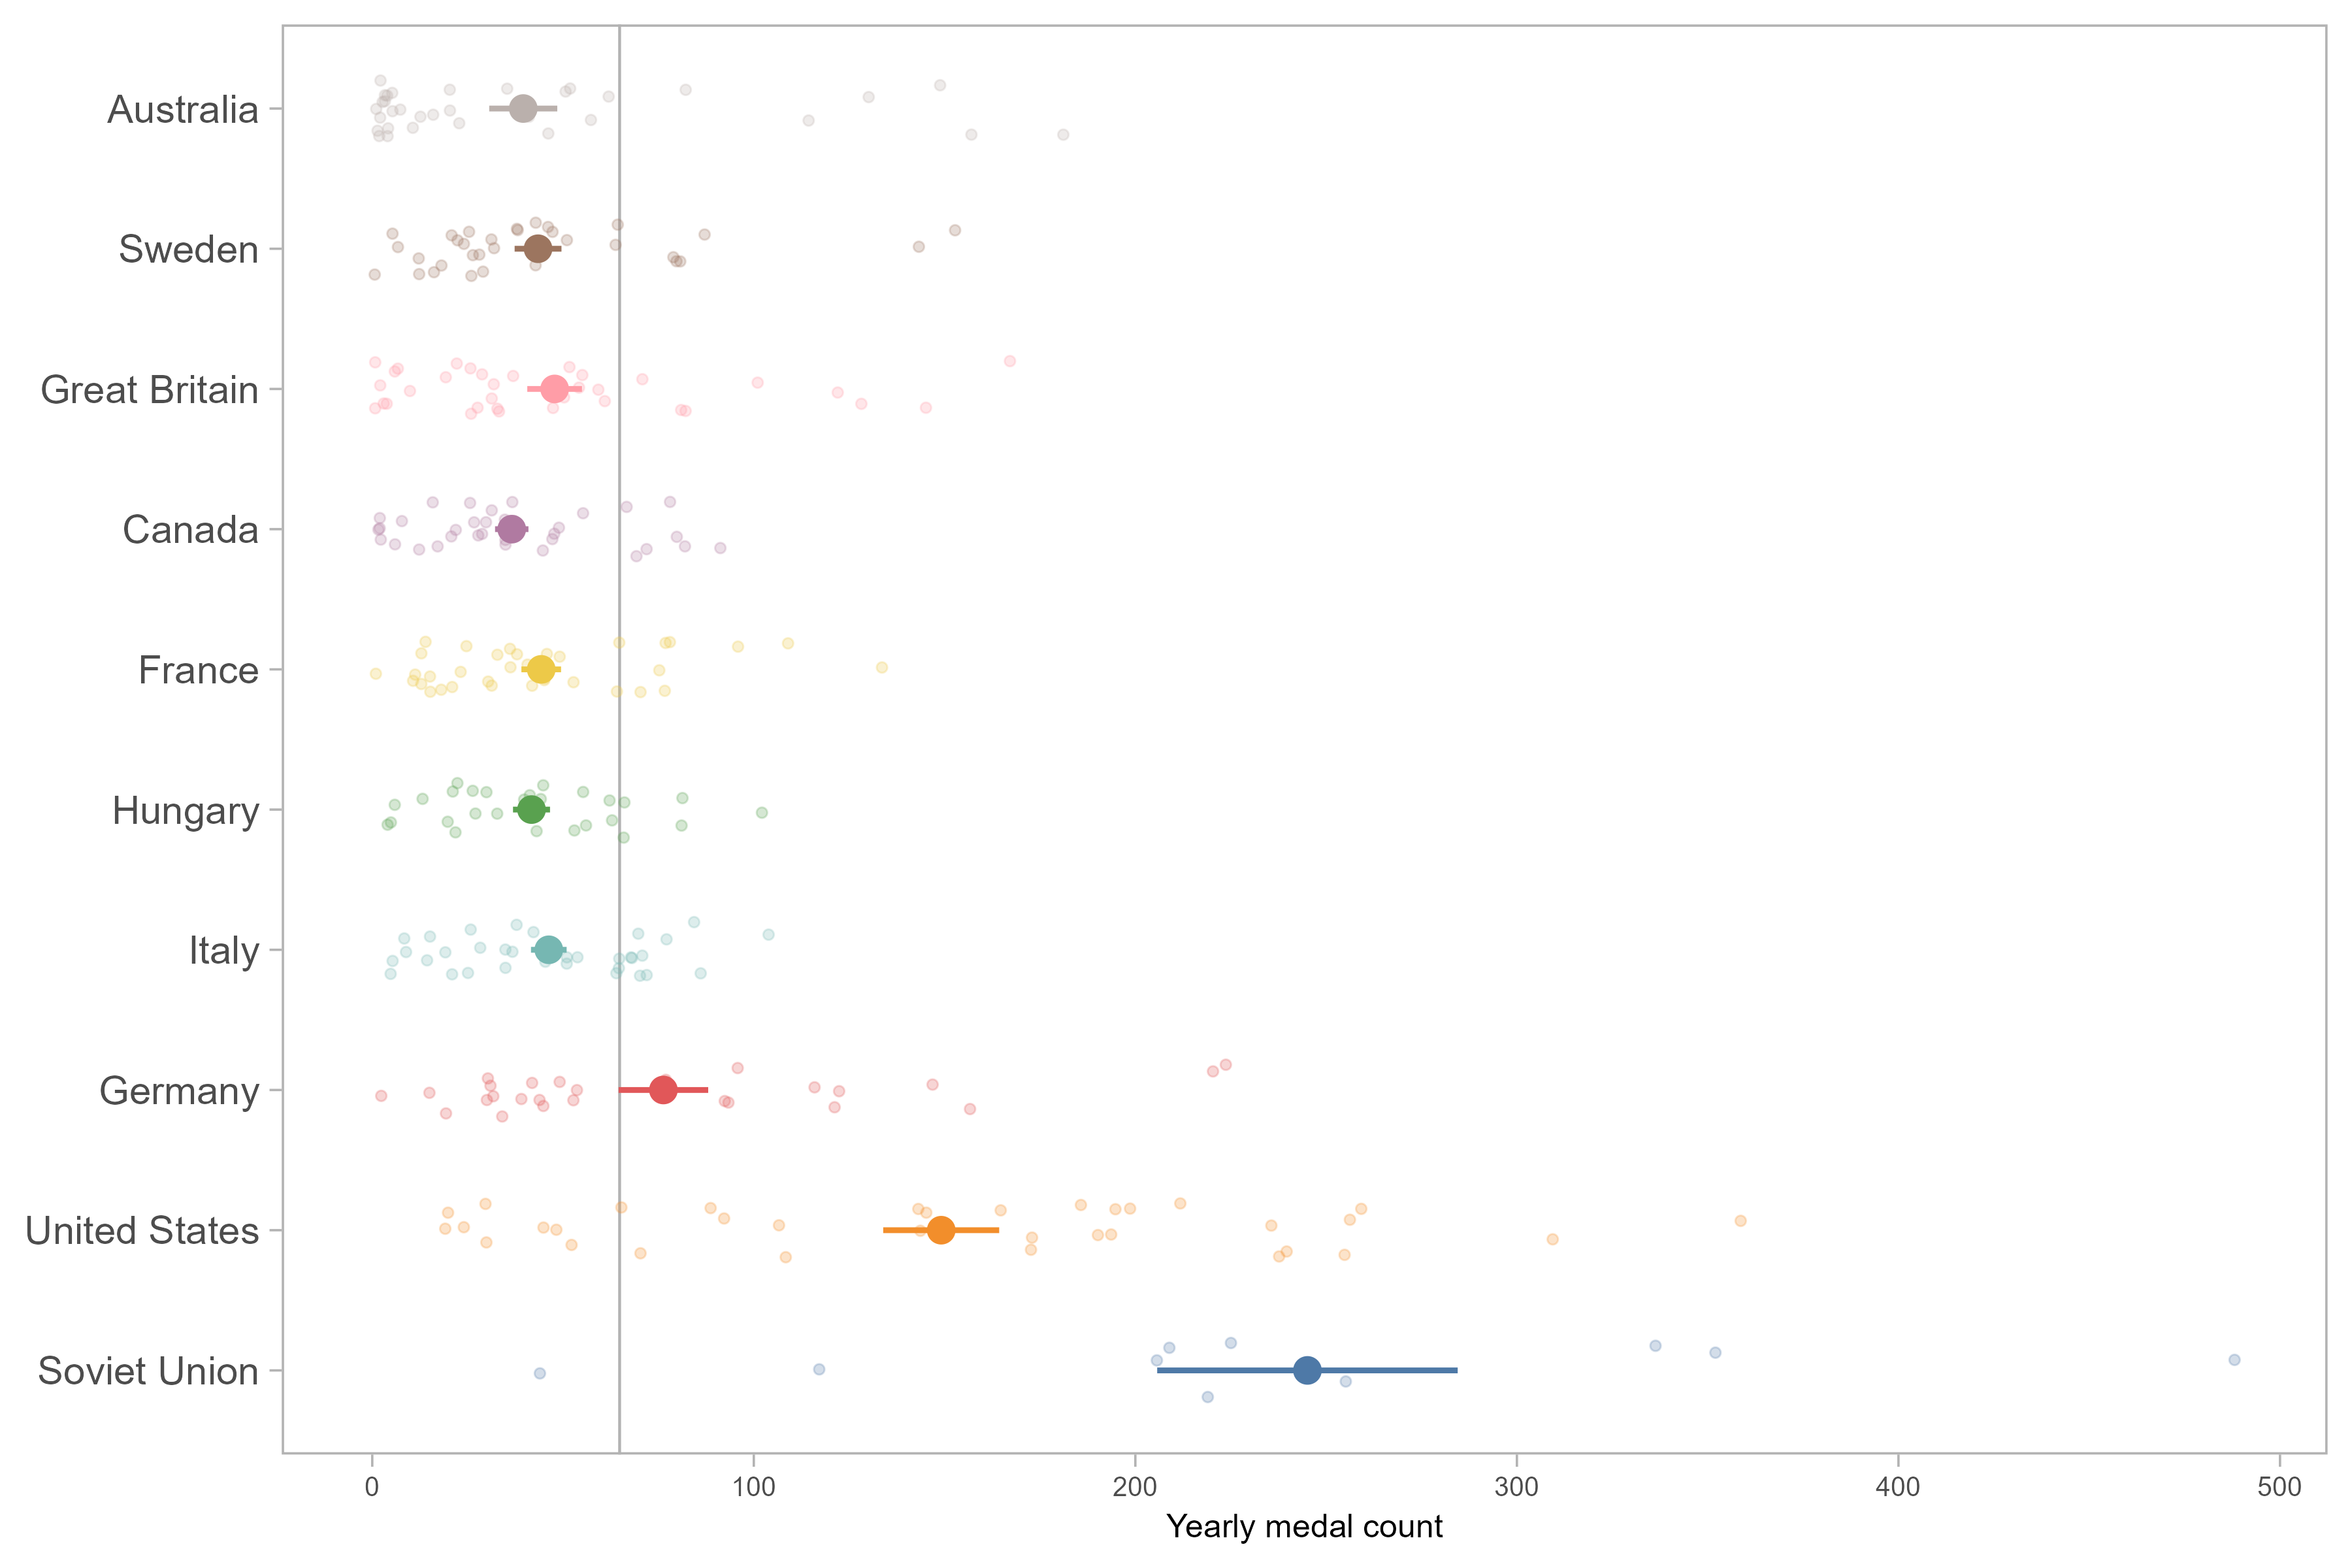
Identify and analyze the top-performing teams in Paralympic history.
- E.g. select only the top 10 teams with the most medals overall
- See below for an example plot
Investigate the number of medals for different sports
- Which sports have a lot of medals, which have only few?
- Did this change over time?
Which athletes have competed in the most Paralympic Games?
- How many medals did they win?
Useful Functions
In this analysis, the dplyr functions count() and summarize() by group are very useful to summarize the data and look at the summary tables, but also to summarize the data before plotting.
Example analysis
Here is an example of a plot you can try to create (from question 3):