library(tidyverse)Task: Statistical tests
Find the solution here after the session ends.
Get started
We will again use the penguins data included in R.
As always, before you get started with the exercise, make sure that you load the tidyverse
Compare the flipper length of penguins using statistical tests
Question: Does the mean flipper length differ between the 3 penguin species?
Do separate comparisons for
- Gentoo vs. Adelie
- Gentoo vs. Chinstrap
- Adelie vs. Chinstrap
Before you start, create a subset of each species as a vector.
For this, you can use the $ operator:
adelie <- filter(penguins, species == "Adelie")$flipper_len
chinstrap <- filter(penguins, species == "Chinstrap")$flipper_len
gentoo <- filter(penguins, species == "Gentoo")$flipper_len
Follow the decision tree for statistical tests:
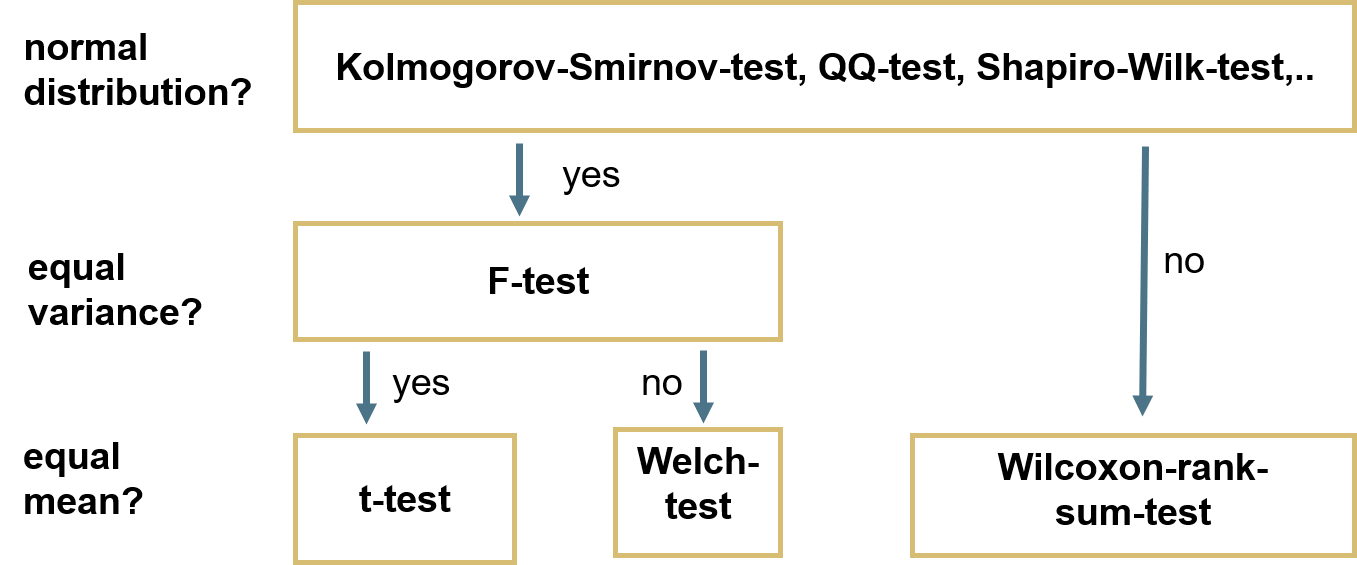
After you have the test results, visualize the differences in flipper length between species.
You can e.g. choose one of the following plots:
- Boxplot with notches
- Mean and standard error of the mean (as mean with errorbar, as barplot, …)
Add a geom_signif() layer to the plot you just created to indicate your test results
For the fast ones
You can do these in any order, or skip them and just take a break.
- Use a different visualization method than before to show the differences in flipper length between species
- Change the appearance of the plot (colors, themes, …) from the task